TL;DR: Pan is a detailed model of yearly average nitrogen dioxide (NO2) across the UK. It uses land-use regression to predict concentrations. It’s trained on monitor data from local and national government, as well as about 36,000 annual results from council diffusion tubes, and road and traffic data. At roadside tubes in councils it never saw, it reads about 1.6 µg/m³ low on average, where Defra’s national map reads 12 µg/m³ low. We’ve produced maps at 25 m for 506 towns and cities and at 200 m for the rest of the UK, which are available now. You can use them for free in any project you like under CC BY 4.0, as long as you credit South London Scientific. For support implementing those projects or access to the underlying model, let’s talk.
I work on lots of excellent projects supporting the use of air quality data. And one of the things I find myself saying most often is “we don’t need more data, we need to use the data we have”. Lots of common problems (exposure assessment, hotspot identification, estimating health harm) need a good quality estimate of air pollution at specific places. You can put up a sensor there and look at the data (a good idea!) but you probably don’t have the time and money to do that everywhere.
We had this problem when developing Clara, our exposure assessment model. Outside London, Clara used Defra’s 1 km Pollution Climate Mapping (PCM) grid, and at the roadside that reads about 12 µg/m³ lower than what councils measure. Clara is moving onto Pan’s maps.
What Pan does
At its heart, Pan is a land-use regression model. That means it combines measured data on air pollution at various locations with information about what happens around those locations: the roads, junctions, traffic signals, bus stops, building heights, even the slope of the road. A full list of sources is on the Pan page.
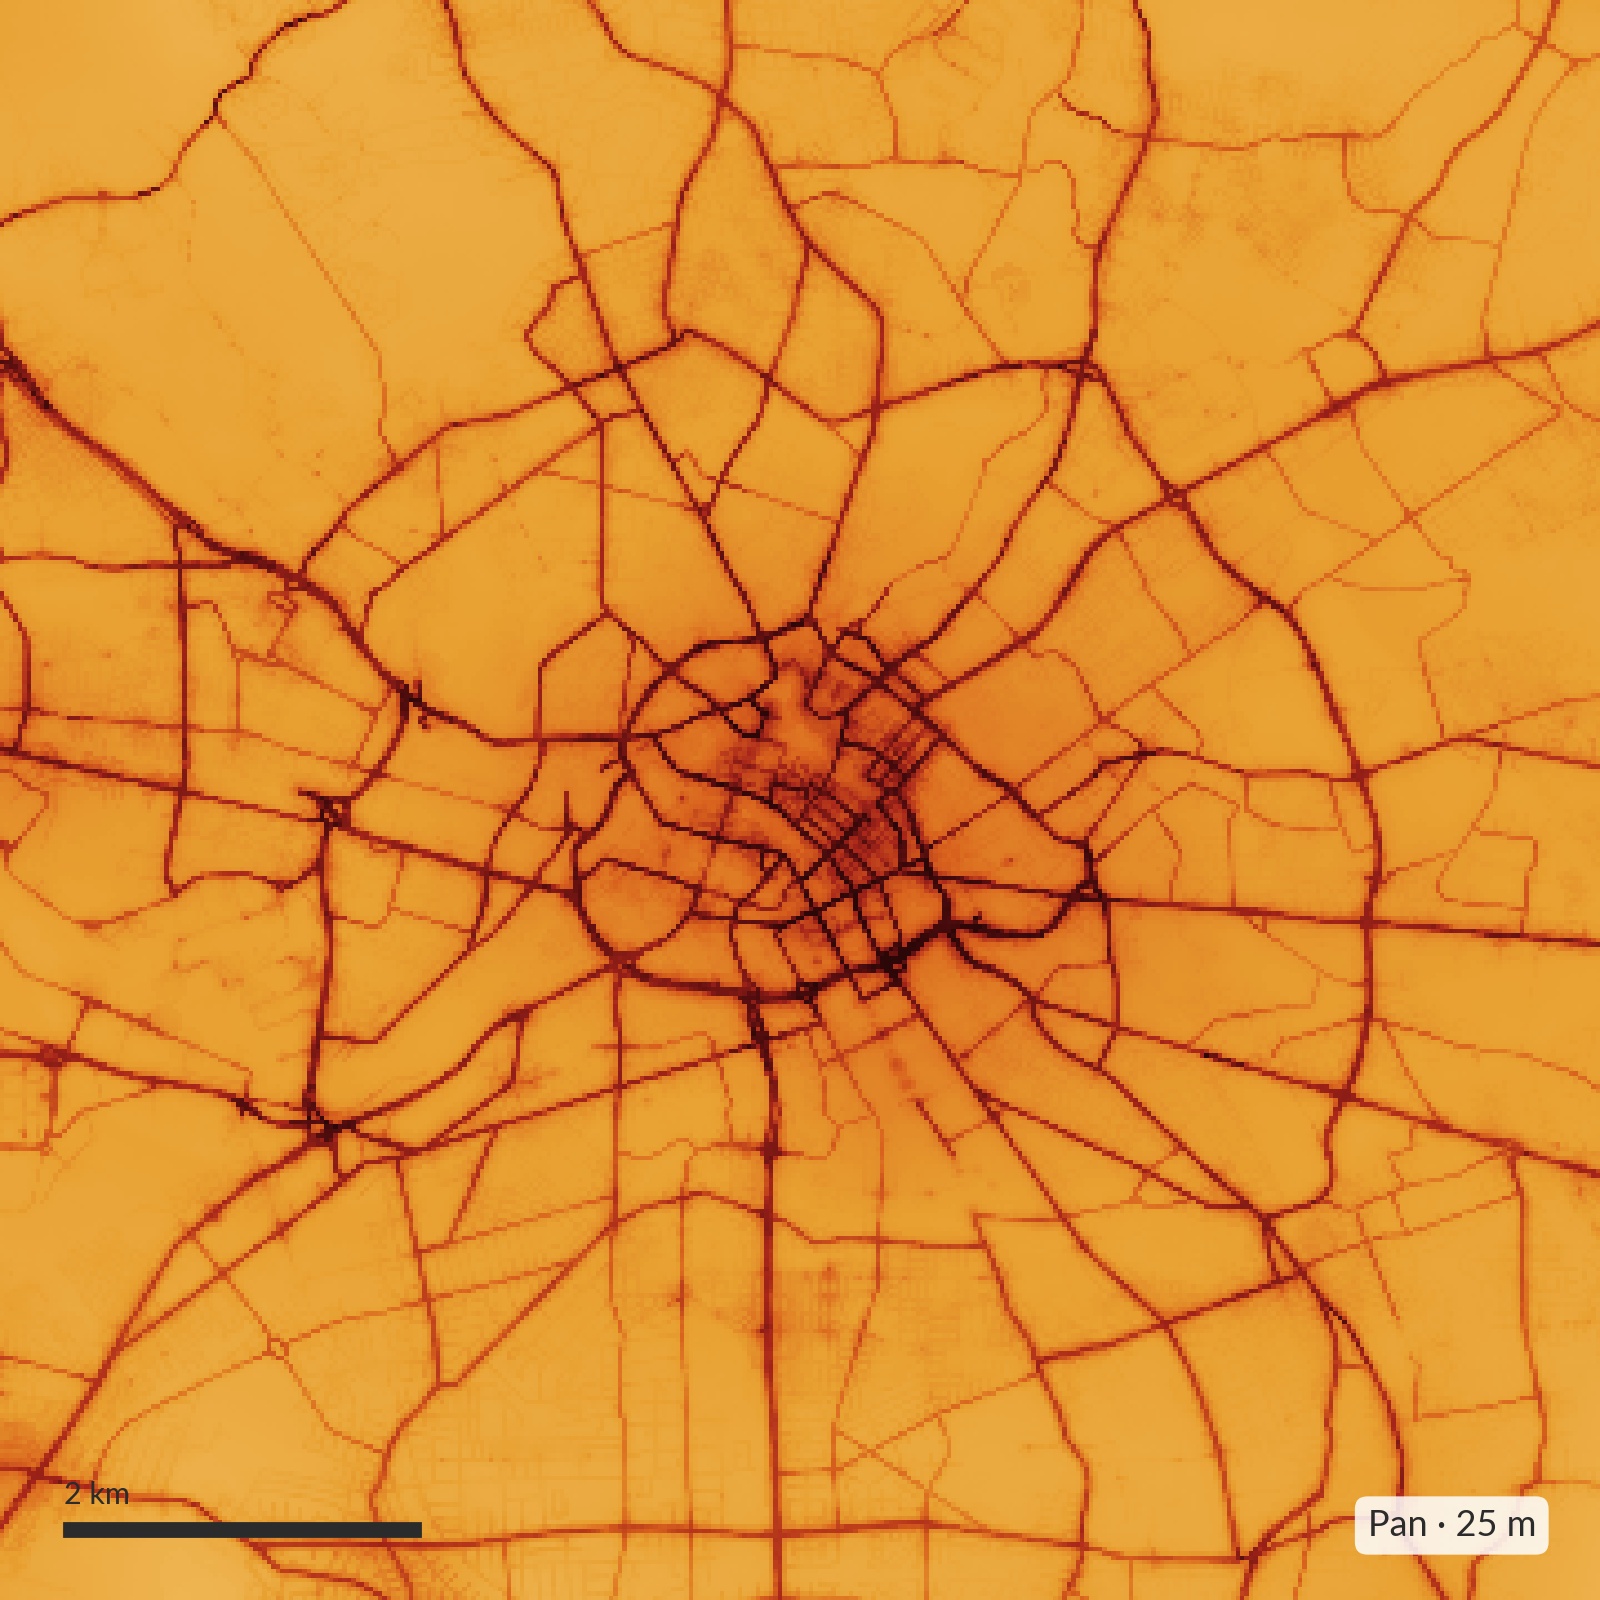
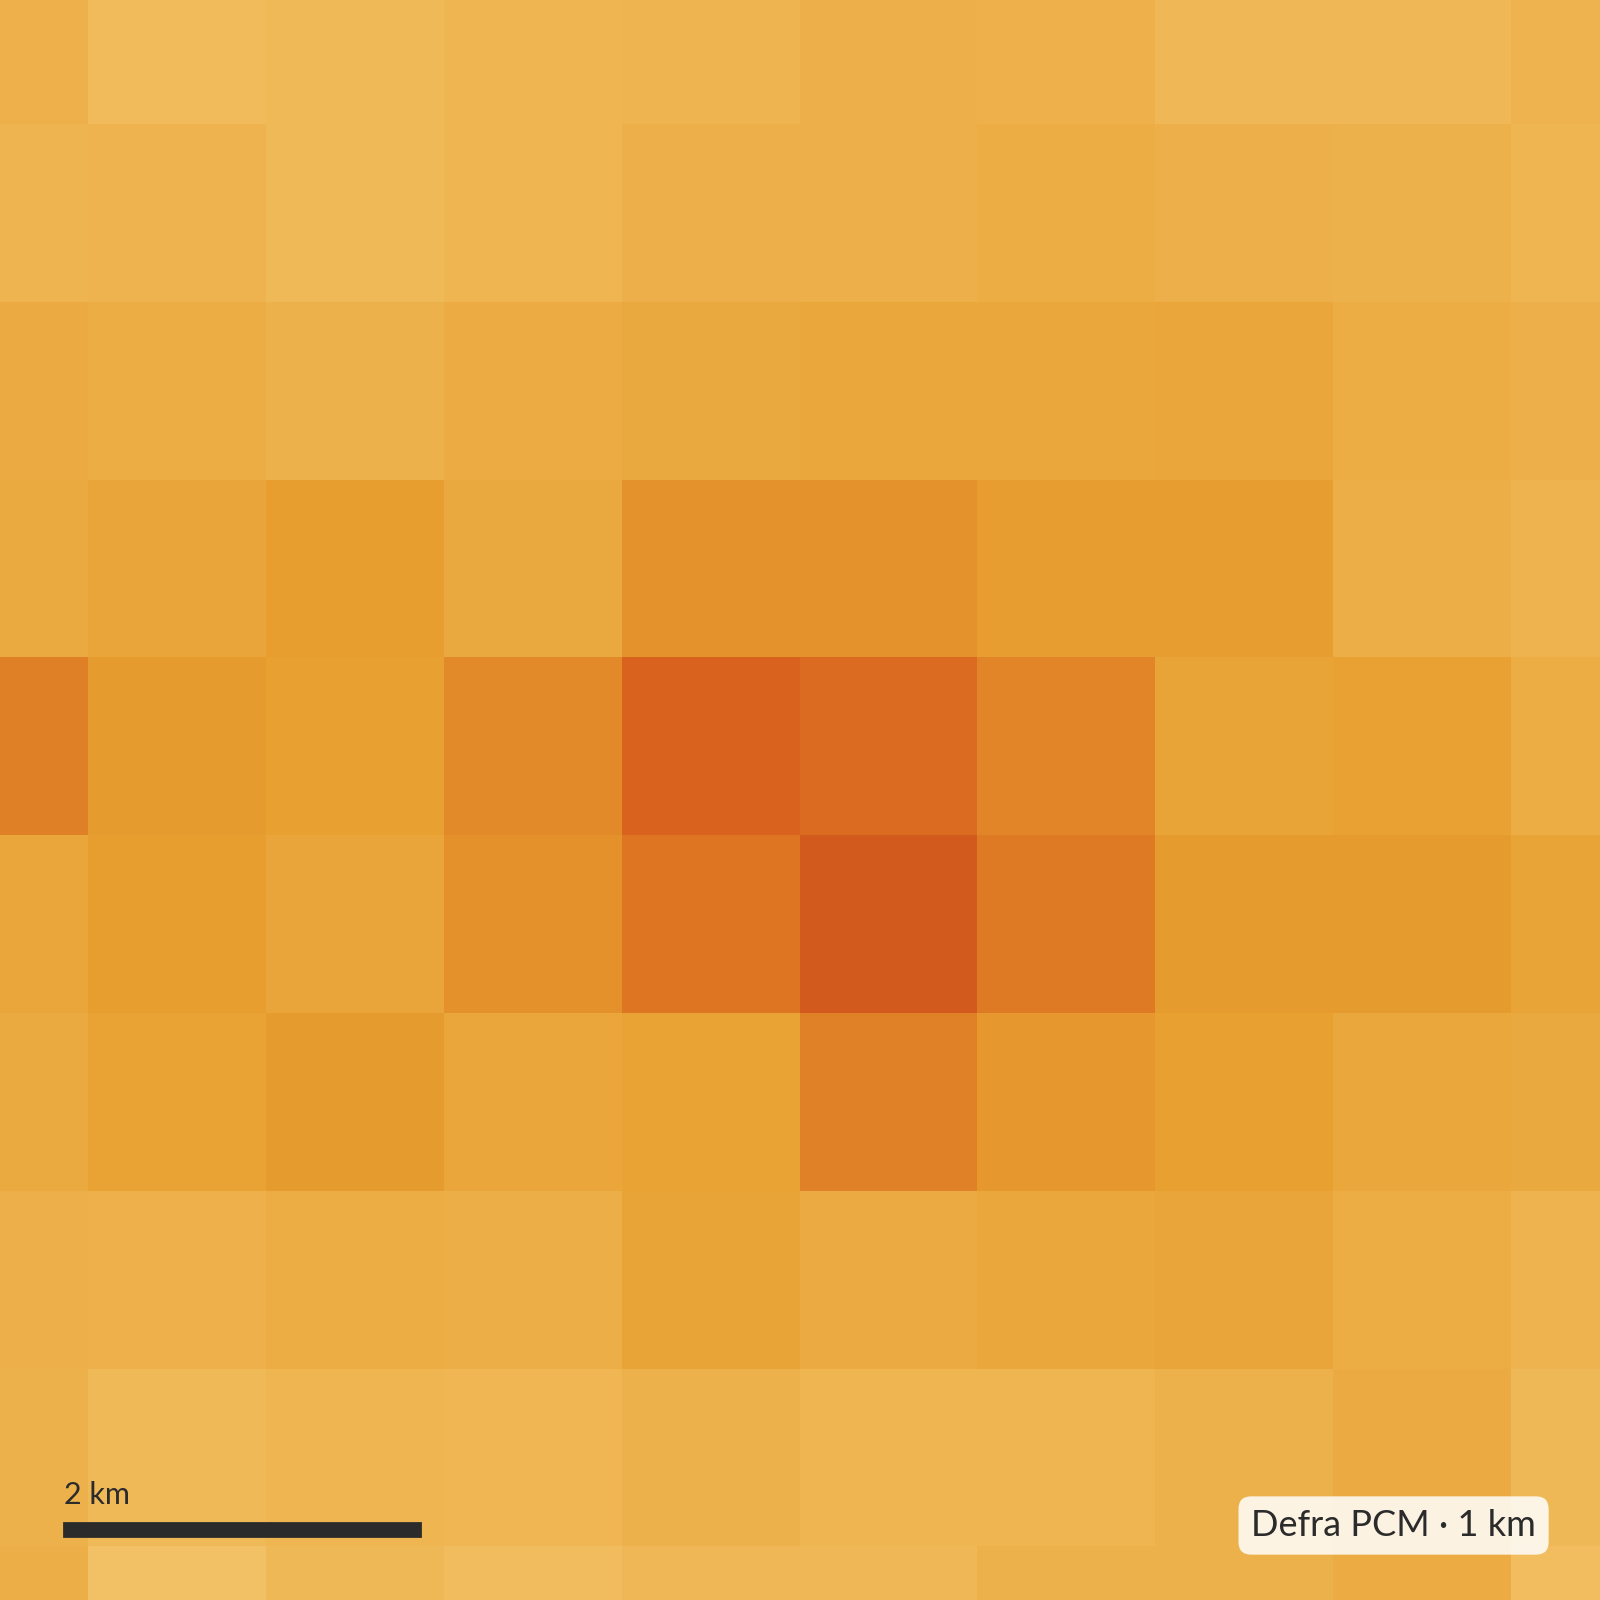
Pan produces annual means for each grid square. The current maps describe 2024. They come at three levels of detail: 25 m squares for 506 towns and cities across Great Britain, 200 m and 1 km squares everywhere else in the UK (including Northern Ireland), and in London a 20 m surface from the London Atmospheric Emissions Inventory, brought up to date to 2024.
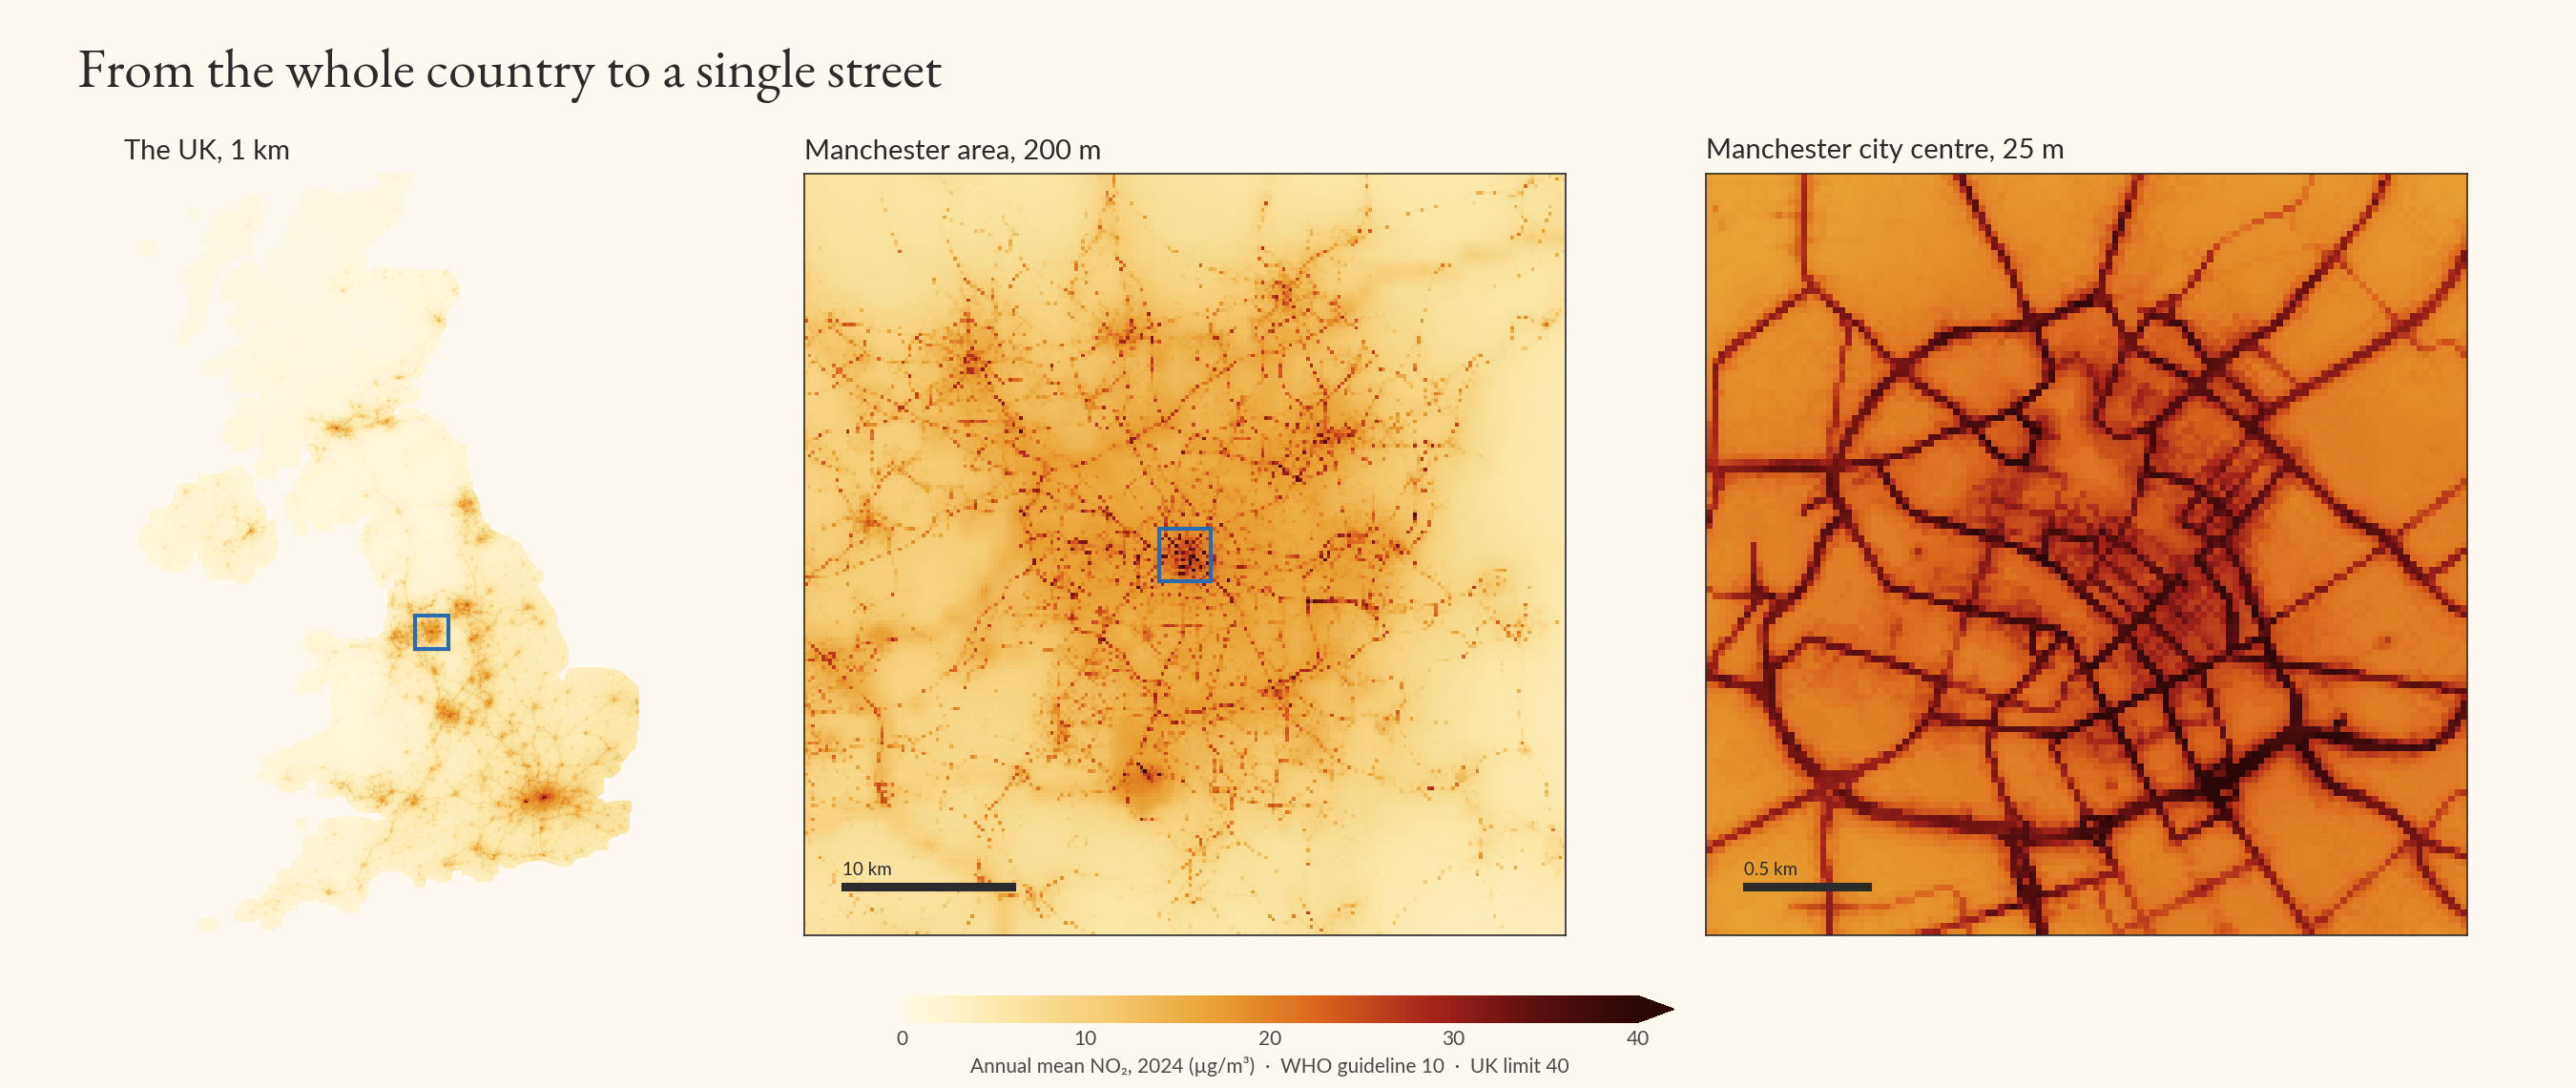
Pan doesn’t start from nothing. In the UK, it’s designed to scale Defra’s Pollution Climate Mapping (PCM) by a factor at each point: the national map knows the regional picture, and Pan adds what happens street by street. That means it’s built on solid foundations, but it also means changes in the underlying maps can change Pan’s results.
What Pan doesn’t do
Pan was originally built to support Clara, as a supplement for the LAEI outside London. As such, it reflects Clara’s needs in its design: it’s intended to estimate annual exposure where people live, work and travel. But air pollution changes over time in ways both predictable and unpredictable. Pan won’t let you estimate pollution yesterday, today or tomorrow (but watch this space).
Pan maps NO2 only. We built and tested a PM2.5 model too, but at council monitors it hadn’t seen it did no better than Defra’s own map, so we haven’t published it. And Pan isn’t a compliance tool: don’t use it on its own to decide whether a place breaches the 40 µg/m³ limit or to declare an Air Quality Management Area.
Where Pan’s data comes from
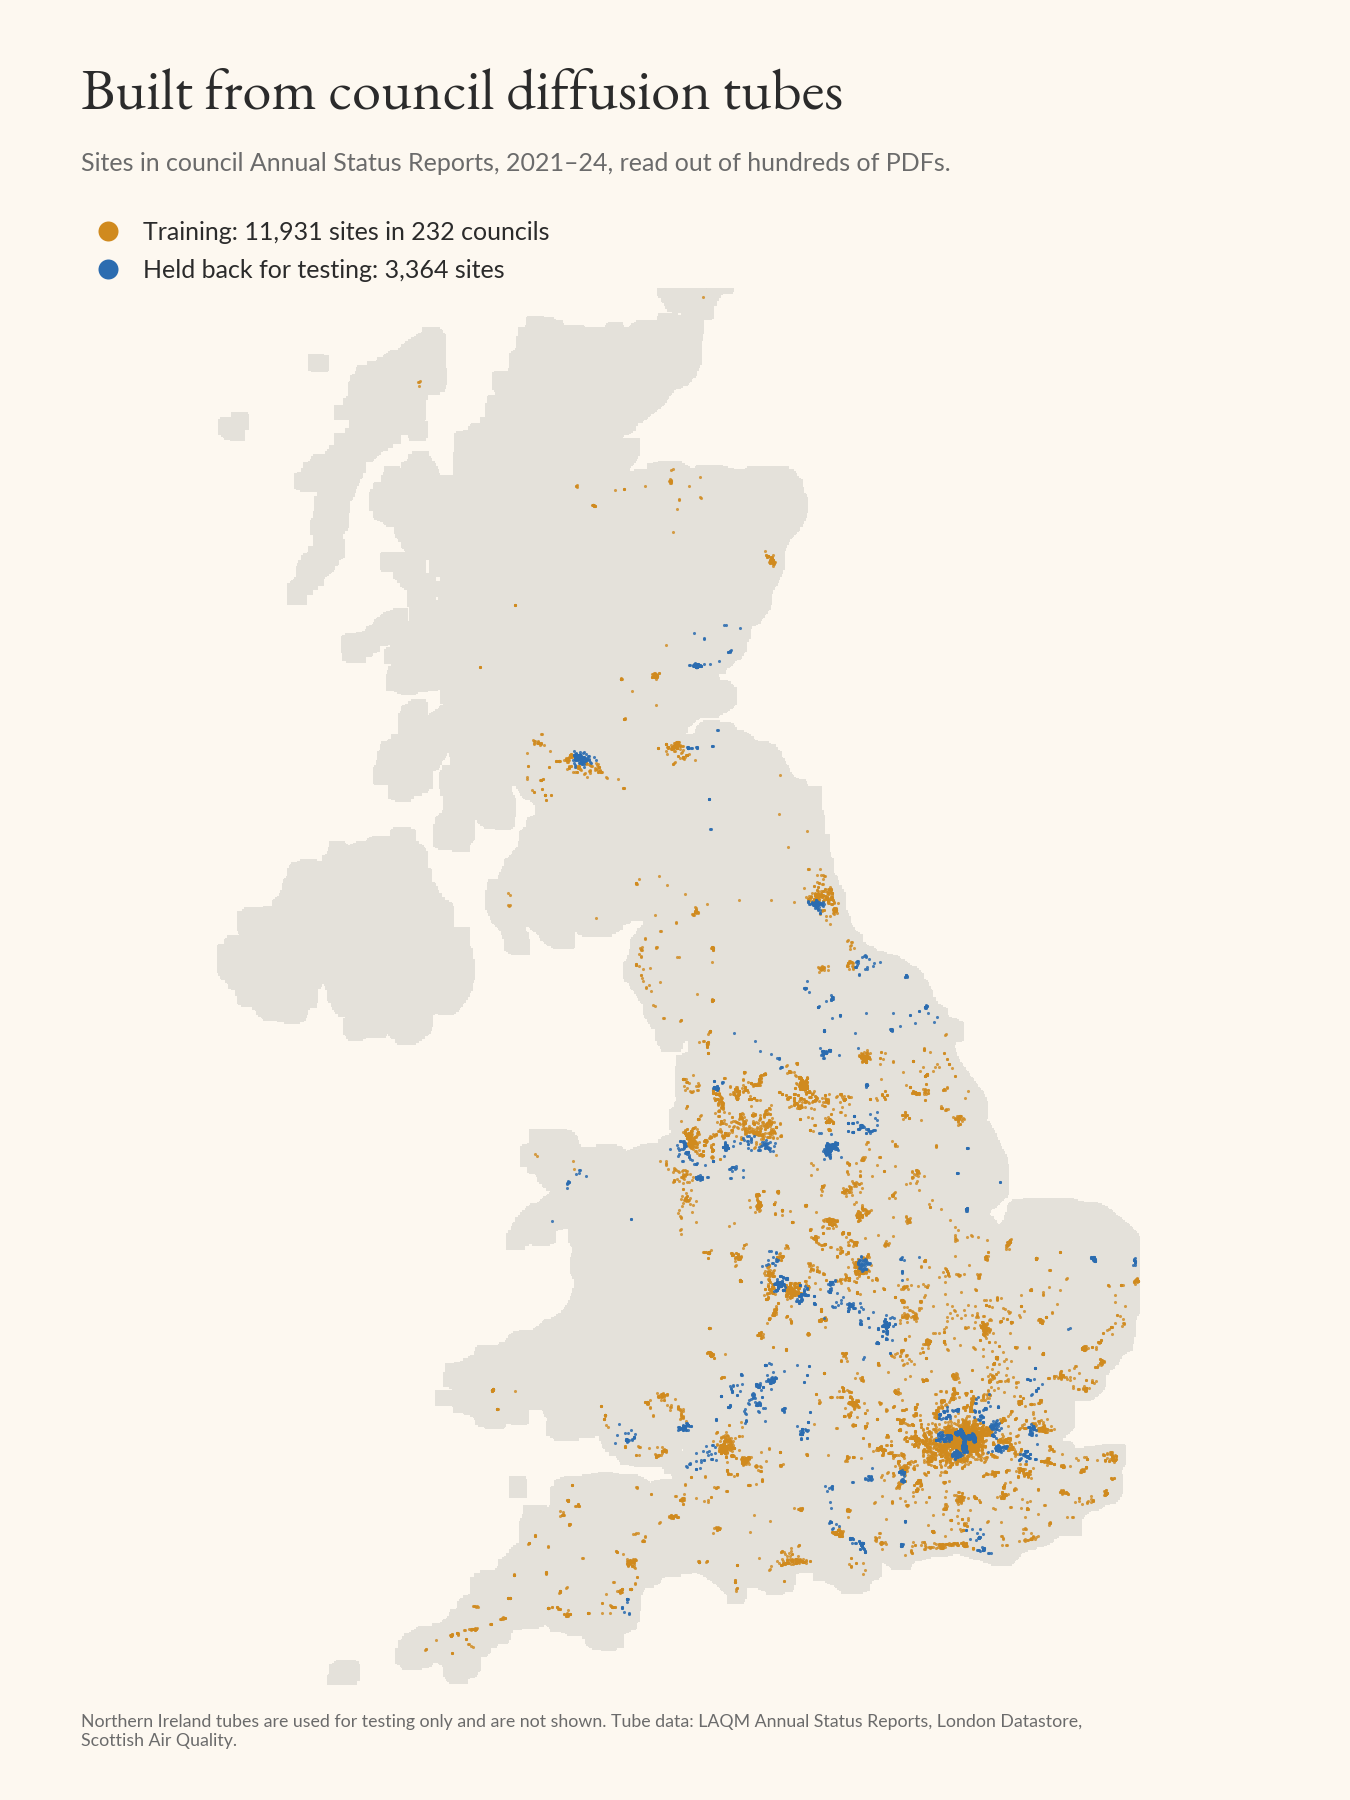
We’ve combined UK regulatory monitoring data with a large dataset of council diffusion tubes (about 36,000 annual results from nearly 12,000 sites in 232 councils across England, Scotland and Wales) drawn from Annual Status Reports. All of this is freely available, but the diffusion tube dataset was a pain to collect in a usable form: it lives in hundreds of council PDFs. Pan wouldn’t exist without the council officers who put up those tubes and publish the results every year, so thank you. We also held back every tube from 78 councils, so that we could test Pan on places it had never seen (a council-level hold-out, for the modellers reading).
What you can do with Pan
In licensing terms, you can do almost anything you want! The maps are available for free under CC BY 4.0: use them, share them and build on them, commercially or not, as long as you credit South London Scientific and the open data they’re built on (the attribution text comes with the files). Download them and open them in QGIS or ArcGIS Pro. If you work in a council, that might mean choosing where to put new tubes, checking exposure around schools and care homes, or deciding which streets an action plan should start with. The model itself is available under licence, for point estimates or bigger modelling jobs, so get in touch if you need more than the maps.
What you shouldn’t do with Pan
Rely on the maps as gospel truth. They’re good, high quality work and I’m proud to stand by them, but if your community is saying there’s a problem somewhere that Pan says is fine, you should put up a monitor or some diffusion tubes. I’d love to hear about it if you do (and can advise on monitor or tube placement for the greatest effect size at lowest cost).
Validation
We’ve produced detailed estimates of Pan’s validity across a range of metrics (summary here). The fairest test is at the 78 councils Pan never saw: at their roadside diffusion tubes, Pan’s 25 m maps read about 1.6 µg/m³ low on average, with a typical error of 4.3 µg/m³. Defra’s map alone reads 12 µg/m³ low at the same tubes. That isn’t a test of what PCM’s grid is for: it’s a background map, and Defra models major roads separately. But the 1 km grid is what most people reach for when they need a number for a place, and this is the gap Pan is built to close. Outside the 506 towns and cities, the 200 m maps can’t see individual kerbs, and they read about 6 µg/m³ low at the roadside.
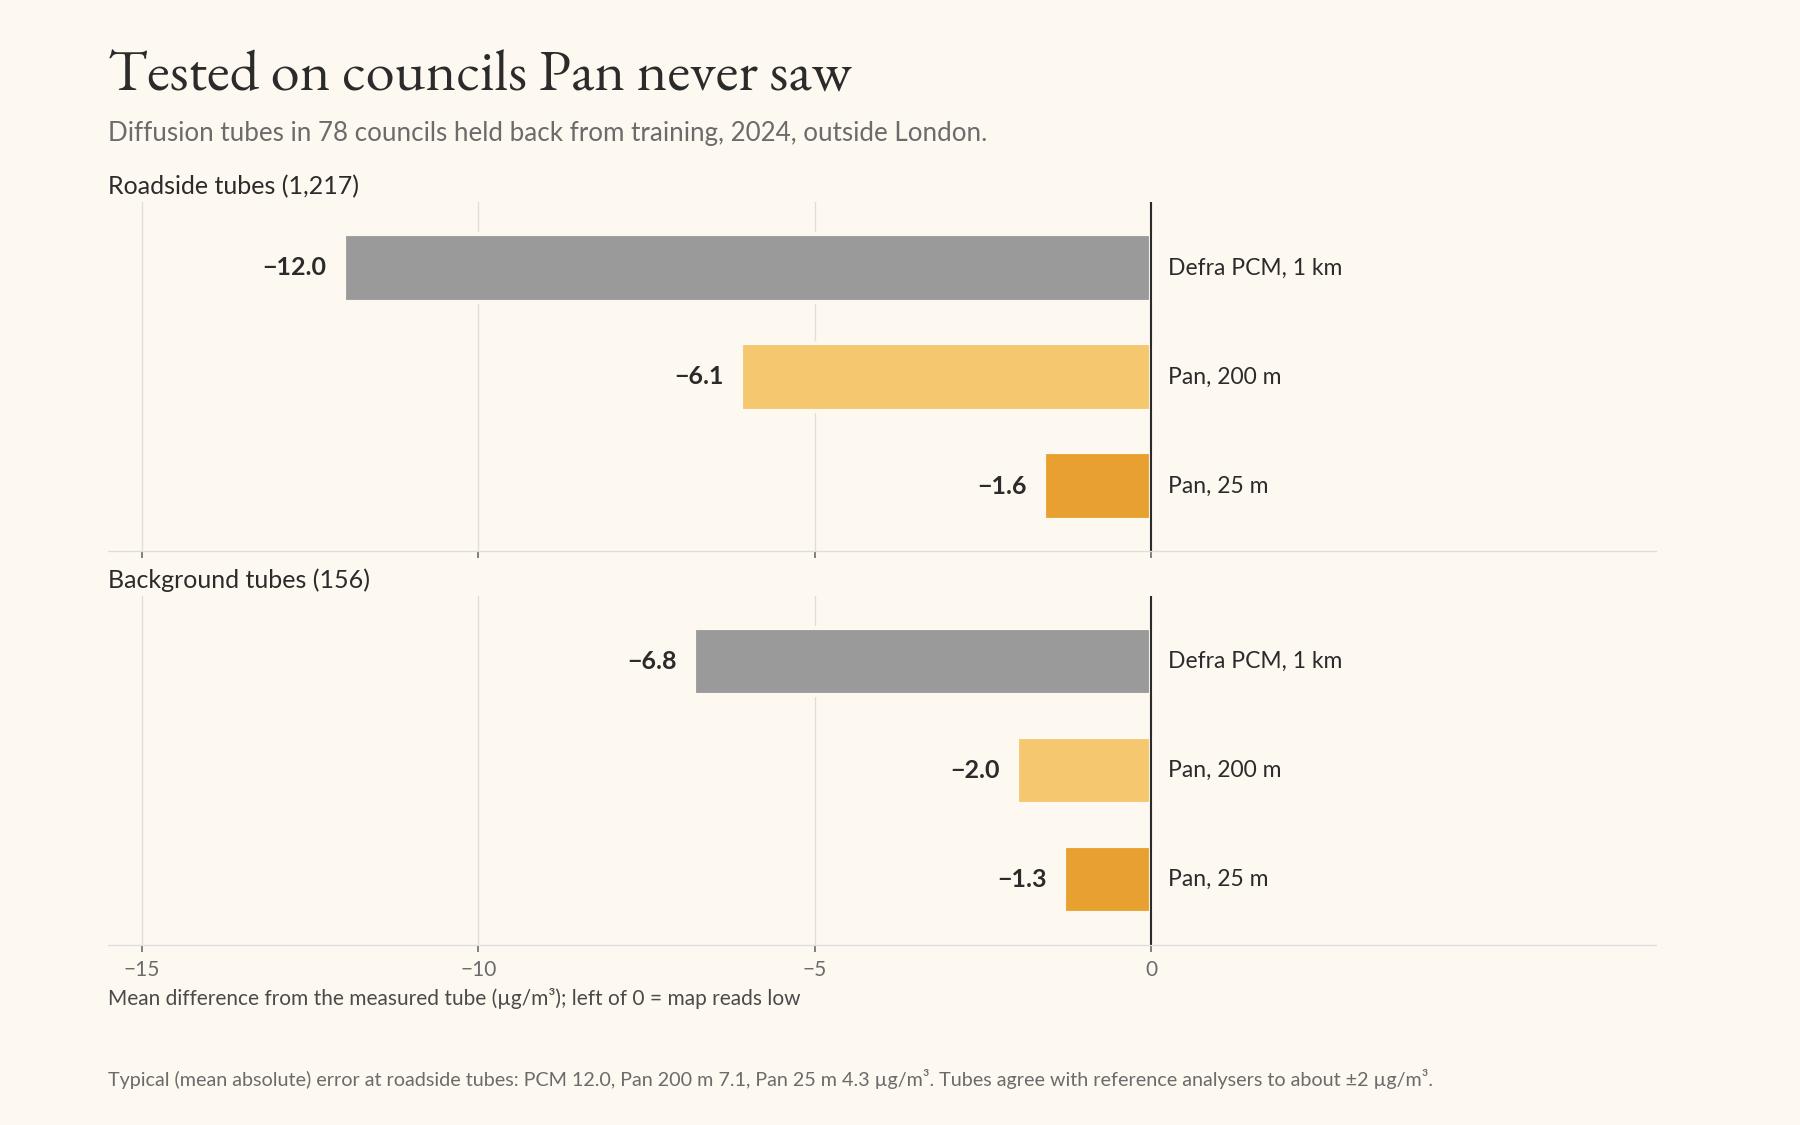
That average hides a tail: a small number of roadside sites read much higher than Pan predicts. They tend to be the same sites year after year (on hills, at queues, in a handful of councils), and a council’s own tubes are the best way to correct the map near them. If you’re a council officer and want to know how Pan does at your tubes, get in touch and I’ll check.
If you’d like to test Pan in your own work (either the annual grids or the model itself) I’d be delighted to see it and to help if you wish. The grids are free to download, but do feel free to reach out for more info.
To cite Pan: Dobson, R. (2026). Pan: street-level annual mean NO2 maps for the UK, 2024 (version 0.6.0) [Data set]. Zenodo. https://doi.org/10.5281/zenodo.23762049