Open data · CC BY 4.0
Pan: street-level NO₂ maps for the UK
Annual mean nitrogen dioxide for 2024, in 25 m squares for 506 towns and cities, 200 m and 1 km squares everywhere else in the UK, and 20 m in London. Free to use, share and build on, as long as you credit us and the open data the maps are built on.
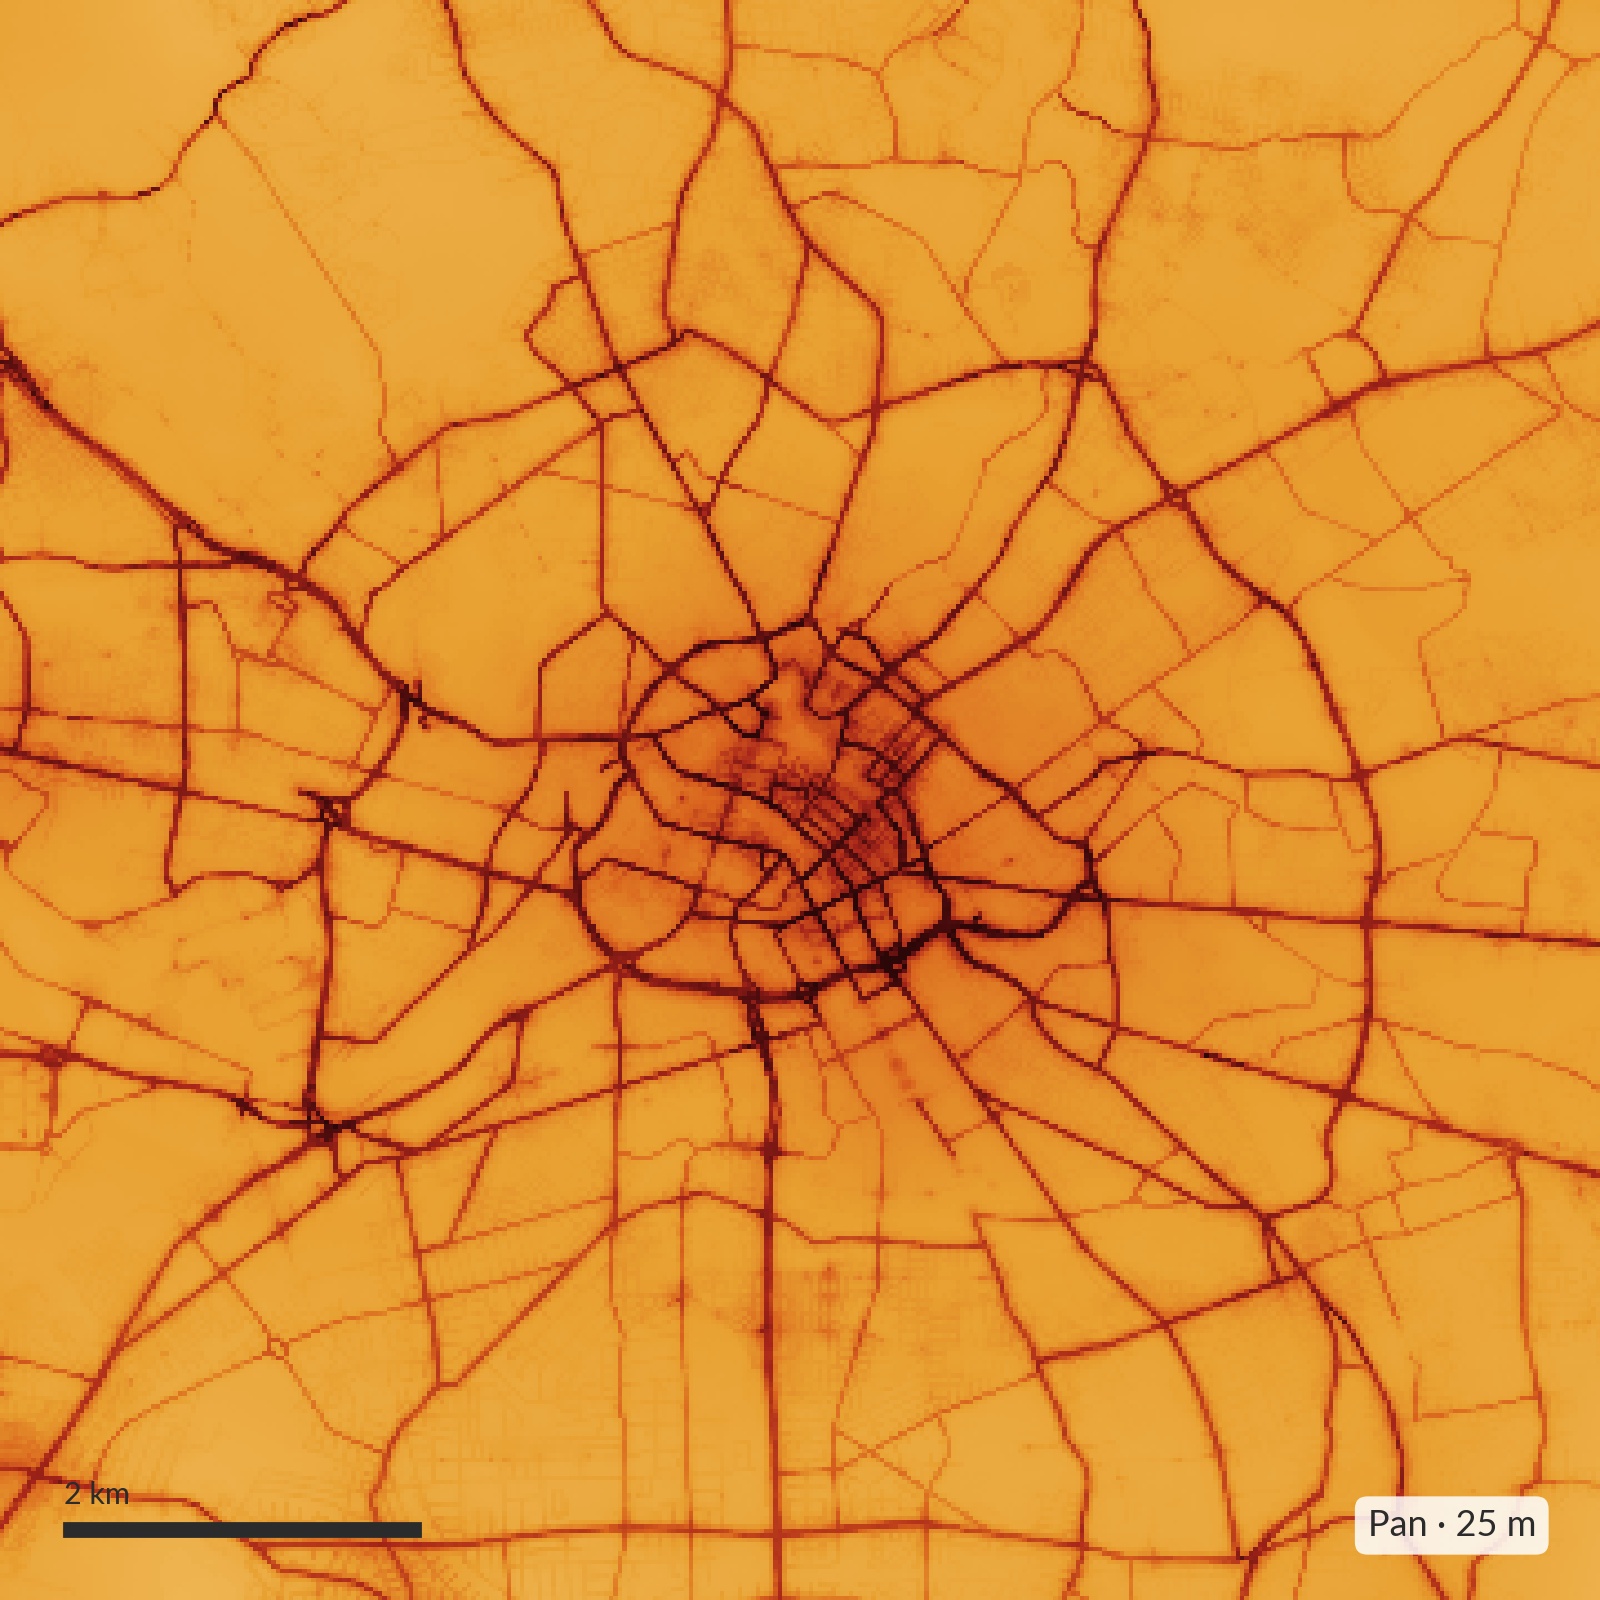
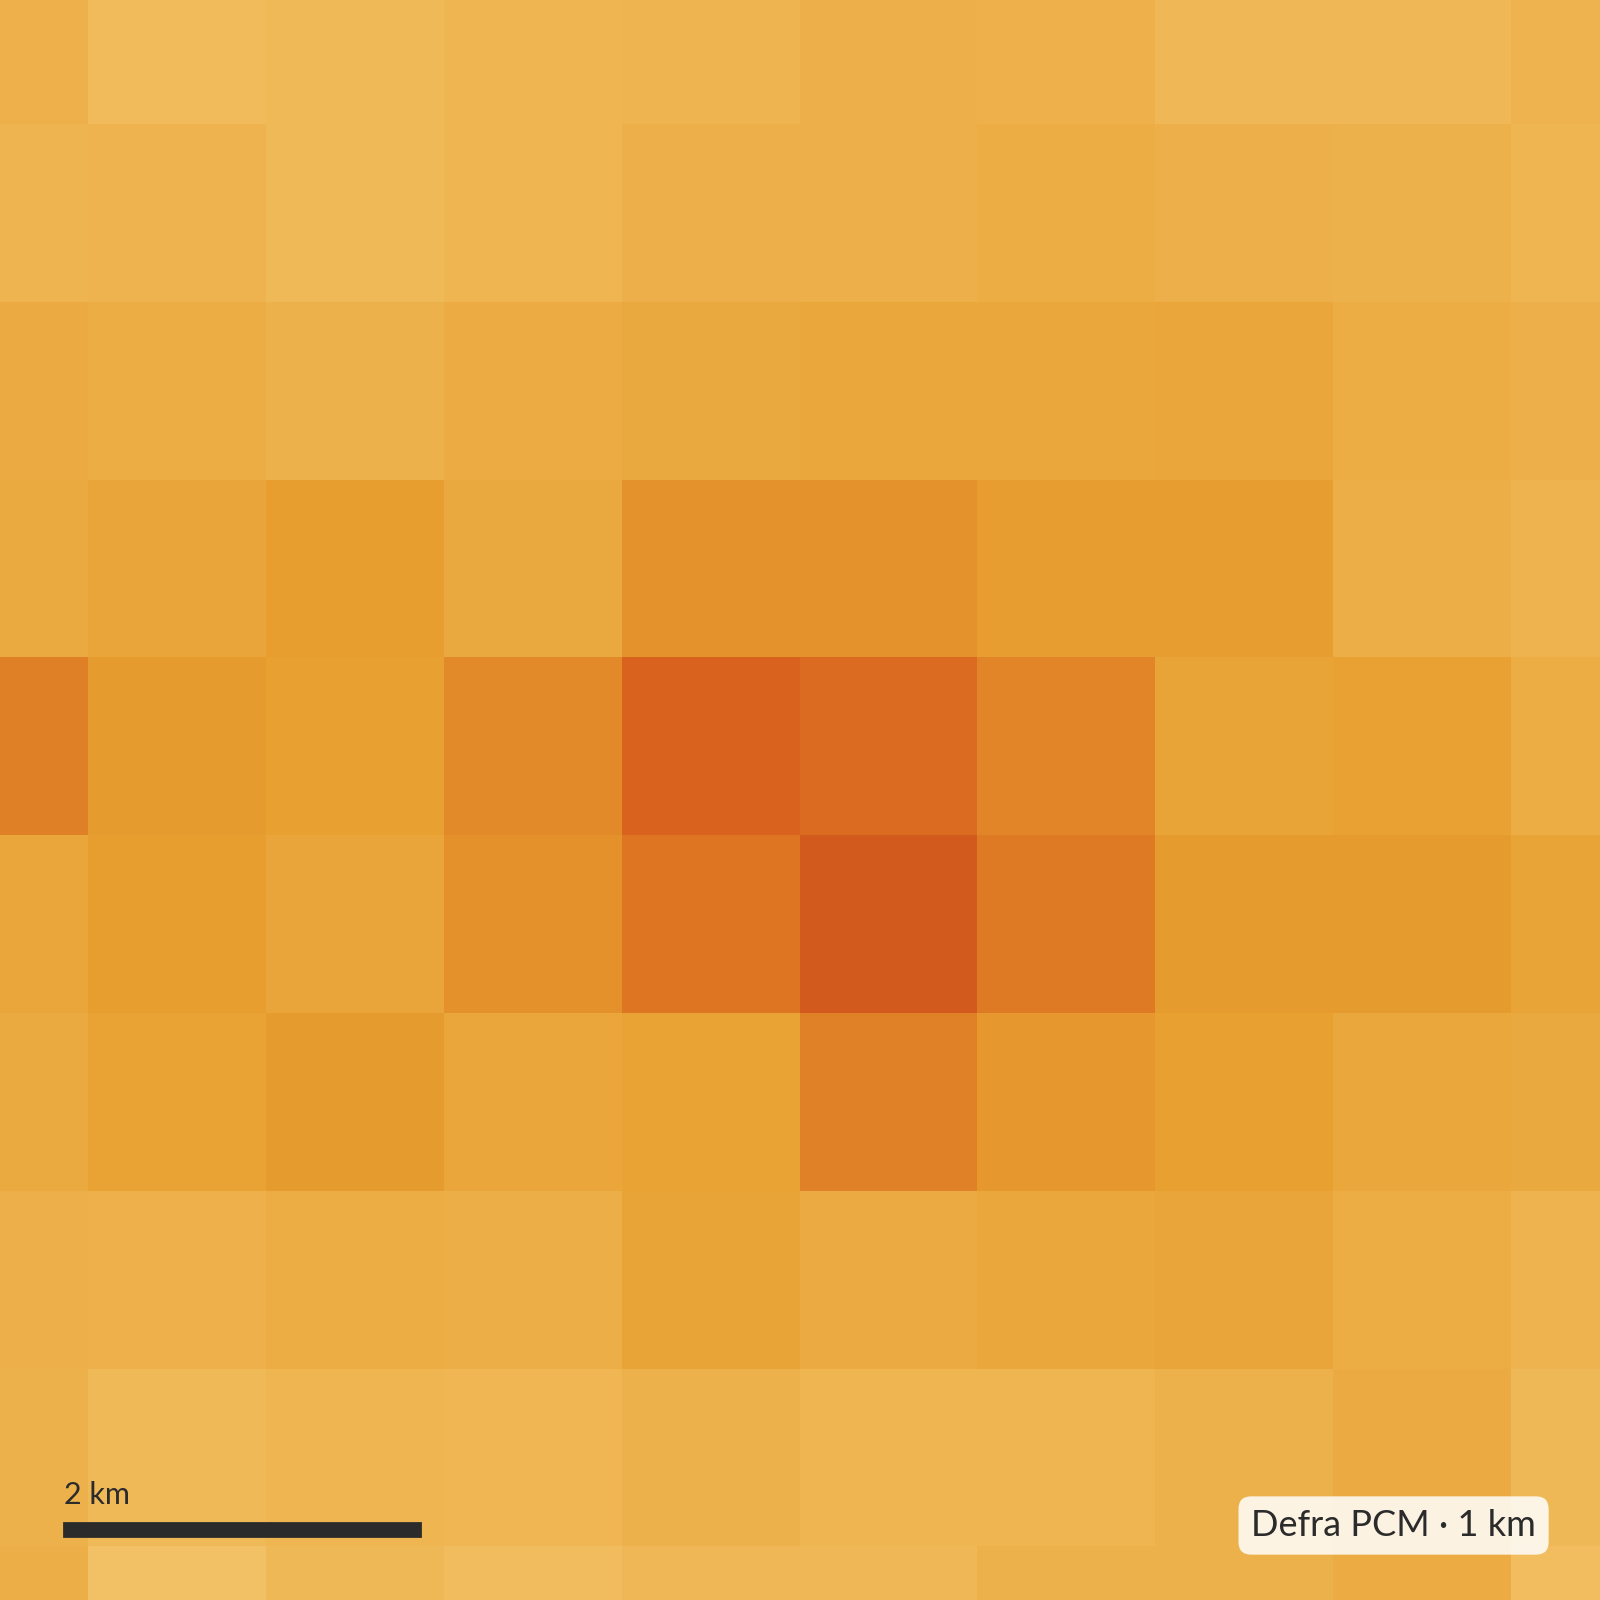
−1.6 µg/m³
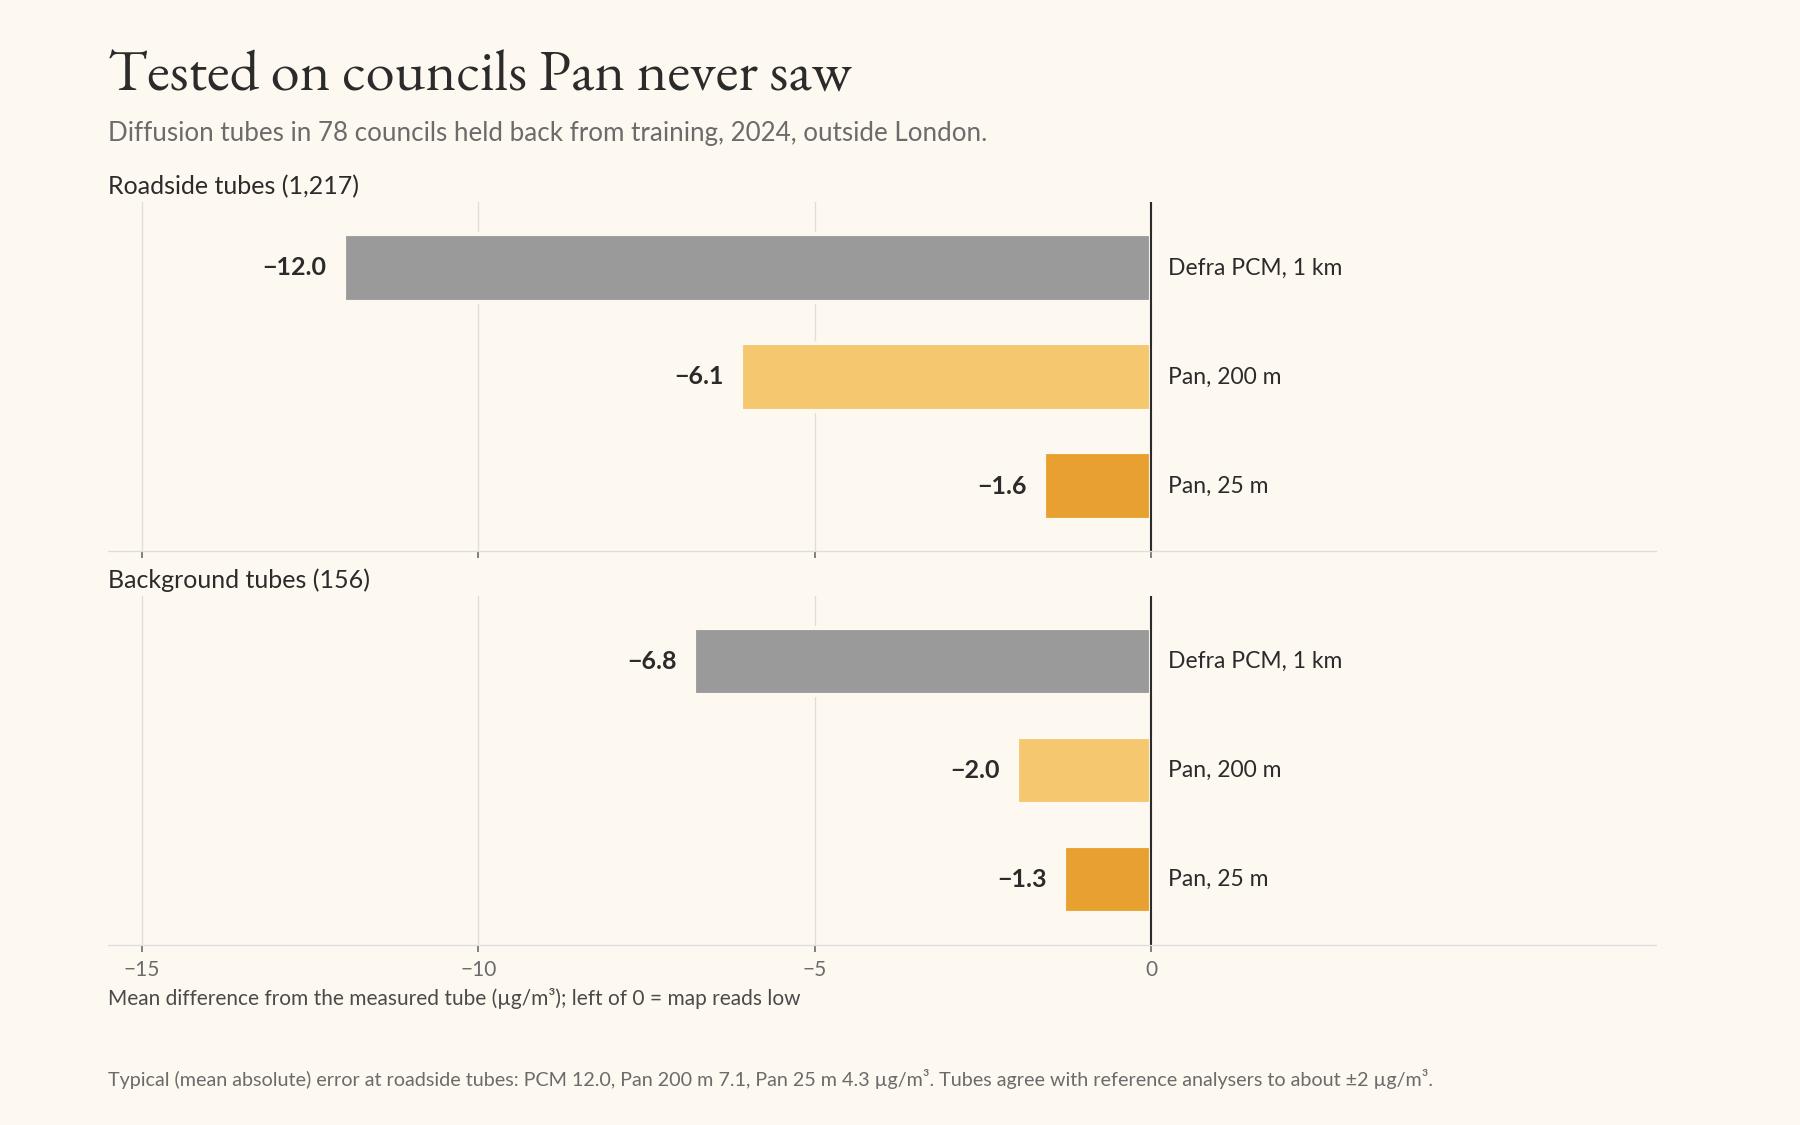
How far Pan's 25 m maps read below measured roadside tubes, on average, in 78 councils the model never saw. Defra's 1 km map reads −12.0 at the same 1,217 tubes.
36,000
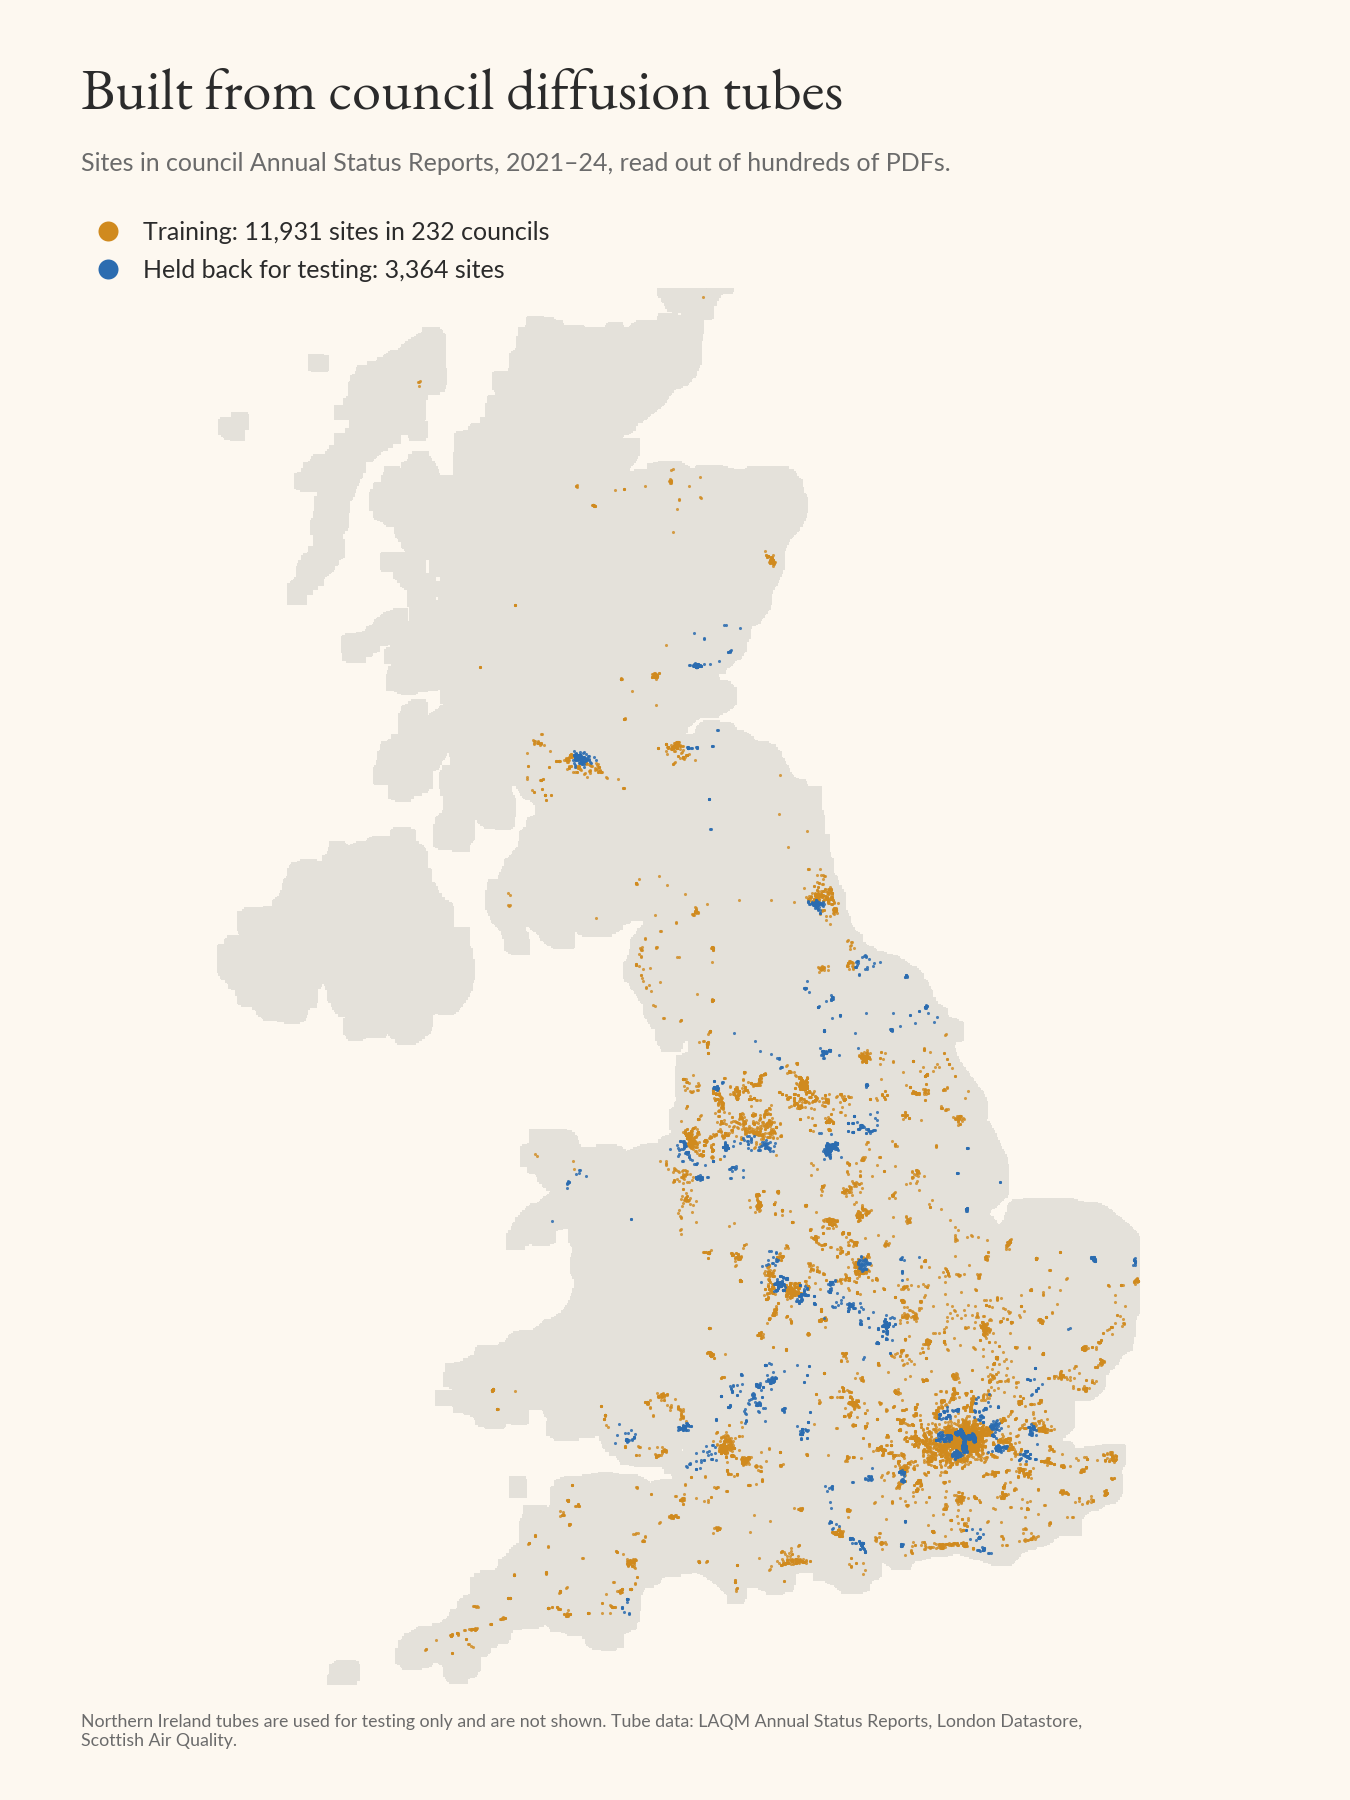
Annual results from council diffusion tubes in 232 councils, read out of hundreds of council reports, used to train the model.
Download
Cloud-Optimised GeoTIFFs in British National Grid (EPSG:27700), values in µg/m³. They open in QGIS and ArcGIS Pro, and QGIS can also stream them straight from the link without downloading (Layer → Add Raster Layer → Protocol: HTTP(S)). Version 0.6.0, published October 2026.
UK, 200 m
Great Britain and Northern Ireland. The best layer outside the 25 m towns.
UK, 1 km
Overview of the whole UK.
London, 20 m
LAEI 2022, scaled to 2024 with London reference monitors.
25 m tile index
Outlines of the 506 town and city tiles (GeoPackage).
QGIS style
The colour scale used on this page, 0–40 µg/m³.
README and licence
What each file is, and the attribution text.
A town or city at 25 m
506 tiles across Great Britain, about 150 MB in all. Start typing a name.
Licence
The maps are licensed under CC BY 4.0. You can copy, share, adapt and build on them, commercially or not, provided you give credit and say if you changed them. The trained model is not covered by this licence; ask us about point estimates or other years.
Cite
Dobson, R. (2026). Pan: street-level annual mean NO₂ maps for the UK, 2024 (version 0.6.0) [Data set]. Zenodo. https://doi.org/10.5281/zenodo.23762049
Attribution to copy
Pan 0.6.0 NO₂ maps, © South London Scientific Ltd, licensed under CC BY 4.0.
Contains public sector information licensed under the Open Government Licence v3.0: DEFRA Pollution Climate Mapping (PCM); Greater London Authority London Atmospheric Emissions Inventory 2022 (LAEI); NAEI road-transport NOx; DfT AADT count points.
Building heights: Microsoft Global ML Building Footprints (CDLA-Permissive-2.0).
Road network, traffic signals, bus stops, stations and taxi ranks: © OpenStreetMap contributors (ODbL).
Terrain: OS Terrain 50, contains OS data © Crown copyright and database right 2026 (Open Government Licence v3.0).
Model trained with council NO₂ diffusion-tube annual means (LAQM Annual Status Reports, London Datastore).
How good are the maps?
Before training, we held back every diffusion tube in 78 councils. The figures below compare the maps with those tubes in 2024, so they measure how Pan does in places it has never seen.
| Held-back tubes | Defra PCM | Pan 200 m | Pan 25 m |
|---|---|---|---|
| Roadside (1,217) | −12.0 (12.0) | −6.1 (7.1) | −1.6 (4.3) |
| Background (156) | −6.8 (7.1) | −2.0 (5.4) | −1.3 (4.9) |
| Wales (61) | −9.8 (9.8) | −3.0 (4.9) | +1.4 (3.8) |
| Scotland (10) | −7.4 (7.4) | −2.3 (4.1) | −1.1 (3.3) |
What the maps get wrong
- A tail of hotspots. A small number of roadside sites read much higher than Pan predicts. They tend to be the same sites year after year: on hills, at queues, and in a handful of councils. A council's own tubes are the best way to correct the map near them.
- The 200 m map can't see kerbs. Outside the 506 towns and cities, roadsides read about 6 µg/m³ low.
- Urban background monitoring stations read slightly lower than Pan (about 1 µg/m³), because Pan leans towards where people live and travel.
- The dirtiest roadsides are under-read most. These are often in more deprived areas, so health-burden estimates made with Pan may understate exposure where it is highest.
- It inherits Defra's map, including changes in how that map is made from one year to the next.
- It is not a compliance tool. Don't use it on its own to decide whether a place breaches the 40 µg/m³ limit or to declare an Air Quality Management Area.
How Pan is made
Pan is a land-use regression model. It starts from Defra's Pollution Climate Mapping (PCM), which gets the regional picture right in 1 km squares, and predicts how much higher or lower each spot is than its square, from what is around it: roads, junctions, traffic signals, bus stops, building heights and the slope of the road.
It learns that from measurements: the national monitoring networks (AURN, and the Scottish, Welsh and English networks), the London Atmospheric Emissions Inventory, and about 36,000 annual results from council diffusion tubes, 2021–24. In London we serve the LAEI itself, scaled to 2024.
Sources
- Defra Pollution Climate Mapping, 2024 (OGL v3)
- GLA London Atmospheric Emissions Inventory 2022 (OGL v3)
- National Atmospheric Emissions Inventory, road transport NOx (OGL v3)
- DfT road traffic counts (OGL v3)
- OS Terrain 50 (OGL v3)
- OpenStreetMap: roads, signals, bus stops, stations, taxi ranks (ODbL)
- Microsoft Global ML Building Footprints (CDLA-Permissive-2.0)
- Council diffusion tubes: LAQM Annual Status Reports, London Datastore, Scottish Air Quality
- Monitoring: AURN, SAQN, WAQN, AQE
Questions
What about PM₂.₅?
Pan's maps are NO₂ only. We built and tested a PM₂.₅ model, and at council monitoring sites it hadn't seen it did no better than Defra's own map, so we haven't published one. Most PM₂.₅ is regional, and the local part is much harder to map than NO₂. For now, use Defra's PCM maps.
Can I get other years, or a value at an exact address?
The published maps describe 2024. The model can produce other years and exact points, and can be corrected with a council's own tubes. Get in touch.
Does it cover the Republic of Ireland?
Not yet. Northern Ireland is covered at 200 m and 1 km.
Pan says my street is fine, but we think it isn't.
Trust the measurement over the map. Put up some diffusion tubes or a monitor; we're happy to advise on where to put them, and we'd like to hear what you find.
Using Pan in your work?
We can help with exposure assessment, hotspot screening and correcting the map with your own monitoring, and we can give you access to the model for point estimates and other years.
Get in touch